Hi i think there may be a mistake in the implementation of the visualization function in plots.py and we should change this part of code like this otherwise we switch the genders. Is it correct?
All depends on what is (arbitrarily, but consistently) defined as label 0 or 1.
Make sure you are using the most recent version of the code, you can see the (label plot change) diff here.
Extra information: Line 15 in helpers.py, the function load_data() converts the label "Male" to class 0:
helpers.py
load_data()
Male
0
converters={0: lambda x: 0 if b"Male" in x else 1}
So the inverse conversion (lines 15-16) in plots.py, which is what you propose as well, should be correct:
males = np.where(y == 0)
females = np.where(y == 1)
(you can add code by using ``` <code> ``` )
Visualization function
Hi i think there may be a mistake in the implementation of the visualization function in plots.py and we should change this part of code like this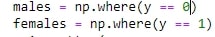 otherwise we switch the genders.
Is it correct?
1
All depends on what is (arbitrarily, but consistently) defined as label 0 or 1.
Make sure you are using the most recent version of the code, you can see the (label plot change) diff here.
Extra information:
Line 15 in
helpers.py, the functionload_data()converts the label "Male" to class0:So the inverse conversion (lines 15-16) in plots.py, which is what you propose as well, should be correct:
(you can add code by using
```
<code>
```
)
1
Add comment